

1
Introduction
For an entire
transcriptome study, RNA-seq based on next-generation DNA
sequencing(NGS) is widely used for several advantages compared to microarray (Wang, et al., 2009). Microarray has several limitations
such as background effect which limits the accuracy of expression measurements,
particularly for transcripts present in low abundance. On the other hand, RNA-Seq
has considerable advantages for examining transcriptome fine structures such as
the detection of novel transcripts, allele-specific expression, and splice
junctions (Zhao, et al., 2014).
One of the aims for transcriptome study is to
quantify the expression level of each transcript (Mantione, et al., 2014). Expression level in
the early mouse embryo allows understanding development system (Sharov, et al.,
2003). Embryonic 9.5 days and 13.5 days
were compared to find DEG in the different embryonic stages.
2
Methods
2.1 Collecting data and
quality control
The 5 samples of RNA-seq data were downloaded
from NCBI SRA database as summarized in the Table 1. The quality of each base of the paired end
reads was visualized using fastQC. Using The raw reads
were trimmed by filtering out adaptor-only nucleotides with 75bp minimum
length, using Trimmomatic (ver 0.32; (Bolger, et al., 2014)).
Sample
Name
|
Read
Length
|
Read
Count
|
GC
|
Q20
Ratio
|
Q30
Ratio
|
SRS385801
|
101
|
37,903,432
|
47
|
0.99214
|
0.95068
|
SRS385800
|
101
|
31,195,373
|
48
|
0.99149
|
0.94682
|
SRS373441
|
101
|
27,153,928
|
48
|
0.9919
|
0.94854
|
SRS373442
|
101
|
36,245,323
|
48
|
0.98924
|
0.92878
|
SRS373443
|
101
|
50,201,130
|
47
|
0.99232
|
0.95056
|
2.2
Alignment and counting reads
The
resulting reads were aligned to the human genome (GRCm38.p5) using HISAT 0.1.5-beta (Kim, et al., 2015). Analysis
for differential expression across the three conditions was performed by first
obtaining read counts for each gene using HTSeq (Anders, et al.,
2015) .Table2
shows the alignment rate.
SampleName
|
OverallAlignmentRate
|
Aligned Zero
time
|
Aligned one
time
|
Multiple
Alignment
|
SRS385801
|
95.72%
|
4.28%
|
67.37%
|
28.35%
|
SRS385800
|
96.08%
|
3.92%
|
71.02%
|
25.06%
|
SRS373441
|
96.48%
|
3.52%
|
71.89%
|
24.59%
|
SRS373442
|
97.01%
|
2.99%
|
69.09%
|
27.93%
|
SRS373443
|
96.67%
|
3.33%
|
70.82%
|
25.84%
|
Table 2. Alignment rate
2.3
Differential
Expressed gene(DEG) analysis
Differentially
expressed genes were identified using edgeR Bioconductor package (Robinson, et al.,
2010). This is
based on Generalized linear model(GLM) which is used for the analysis of RNA-seq
data by considering gene expression as a negative binomial. We used an FDR < 0.05
significance cutoff for multiple testing adjustment (Benjamini and
Hochberg, 1995).
2.4 Gene ontology (GO) and KEGG
pathway analysis
GO database classifies genes and transcripts
according to the three categories of Biological Process(BP), Cellular
Component(CC) and Molecular Function(MF) provides information on the function
of genes. To characterize the identified genes from DEG analysis, GO-based
trend test was carried out through the Fisher’s exact test. A functional
enrichment analysis was performed by the Database for Annotation, Visualization
and Integrated Discovery (DAVID) (Huang, et al.,
2007).
The Kyoto
Encyclopedia of Genes and Genomes (KEGG) are the major recognized
pathway-related databases that record information on how genes are networked in
various organisms. The functional implications of these modules were then
examined by using DAVID to identify statistically significant KEGG Pathway
terms.
Results
3.1 Statistical test
for DEG
Multi-dimensional plot indicated that samples are distinguished by embryo date (Fig 1). After checking the distance of samples, the statistical test for DEG was performed. The top 10 DEGs by FDR value were visualized (Fig 2). ENSMUSG00000022037, whose gene symbol is Clu, showed higher abundance in 9.5 day compared to 13.5 day. ENSMUSG00000073294, whose gene symbol is AU022751, showed higher abundance in 13.5 day compared to 9.5 day. Total 1855 DEG were selected by FDR < 0.05 significance cutoff.
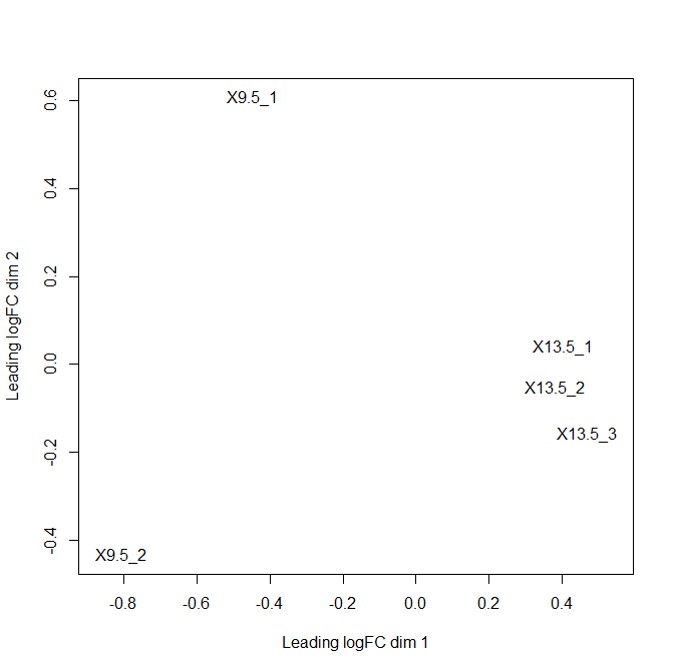

Fig 2. Boxplot for relative abundance of expression
3.2 GO and KEGG PATHWAY analysis
Using
the list of 1855 DEG, we investigated enriched function of DEG (Table 3). KEGG
pathway showed the pathway related to the DEGs. Biosynthesis of antibiotics were
significantly enriched in DEG. The formation of immune system is likely to be
formed between 9.5 and 13.5 days. In biological process, the meiotic cell cycle was significantly enriched. Meiosis is a
specialized type of cell division that reduces the chromosome number by half.
Considering characteristic of embryo cell, these results reflect the biological
function in development.
Count
|
%
|
PValue
|
|
mmu01130:Biosynthesis of antibiotics
|
46
|
2.68
|
6.09E-10
|
mmu01200:Carbon metabolism
|
24
|
1.4
|
2.84E-05
|
mmu00010:Glycolysis /
Gluconeogenesis
|
17
|
0.99
|
3.72E-05
|
mmu01100:Metabolic pathways
|
138
|
8.05
|
4.15E-05
|
mmu01230:Biosynthesis of amino acids
|
18
|
1.05
|
9.15E-05
|
GOTerm :
Biological process
|
Count
|
%
|
PValue
|
37
|
2.158693
|
2.36E-16
|
|
GO:0030154~cell
differentiation
|
117
|
6.826138
|
1.57E-11
|
GO:0007140~male
meiosis
|
15
|
0.875146
|
4.81E-09
|
GO:0007275~multicellular
organism development
|
134
|
7.81797
|
6.97E-09
|
GO:0007283~spermatogenesis
|
67
|
3.908985
|
1.50E-08
|
Table 3. GO and KEGG PATHWAY analysis
References
Anders, S., Pyl,
P.T. and Huber, W. (2015) HTSeq—a Python framework to work with high-throughput
sequencing data, Bioinformatics, 31, 166-169.
Benjamini, Y. and Hochberg, Y.
(1995) Controlling the false discovery rate: a practical and powerful approach
to multiple testing, Journal of the royal
statistical society. Series B (Methodological), 289-300.
Bolger, A.M., Lohse, M. and
Usadel, B. (2014) Trimmomatic: a flexible trimmer for Illumina sequence data, Bioinformatics, 30, 2114-2120.
Huang, D.W., et al. (2007) The DAVID Gene Functional Classification Tool: a
novel biological module-centric algorithm to functionally analyze large gene
lists, Genome biology, 8, R183.
Kim, D., Langmead, B. and
Salzberg, S.L. (2015) HISAT: a fast spliced aligner with low memory
requirements, Nature methods, 12, 357-360.
Mantione, K.J., et al. (2014) Comparing bioinformatic
gene expression profiling methods: microarray and RNA-Seq, Medical science monitor basic research, 20, 138.
Robinson, M.D., McCarthy, D.J.
and Smyth, G.K. (2010) edgeR: a Bioconductor package for differential
expression analysis of digital gene expression data, Bioinformatics, 26,
139-140.
Sharov, A.A., et al. (2003) Transcriptome analysis
of mouse stem cells and early embryos, PLoS
Biol, 1, e74.
Wang, Z., Gerstein, M. and
Snyder, M. (2009) RNA-Seq: a revolutionary tool for transcriptomics, Nature Reviews Genetics, 10, 57-63.
Zhao, S., et al. (2014) Comparison of RNA-Seq and microarray in
transcriptome profiling of activated T cells, PloS one, 9, e78644.